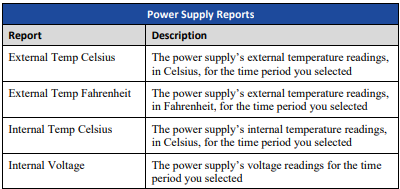
This section describes how to view power supply data that transmitted from in-field ALPR(s) to the TechAlert server during a particular time period. These transmissions display in graph format and include both temperature and voltage readings.
1 If it is not already selected, click the Monitoring tab at the top of the page.
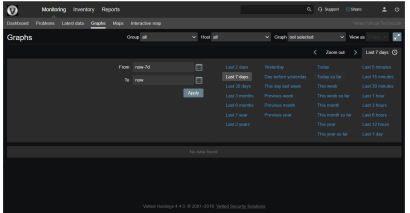
2 Click the Graphs tab. The Graphs page displays.
3 To report on all your agency’s ALPRs (default), proceed to step 4.
– OR –
To report on one of your agency’s ALPRs, go to the top of the page and select an ALPR from the Host drop-down list.
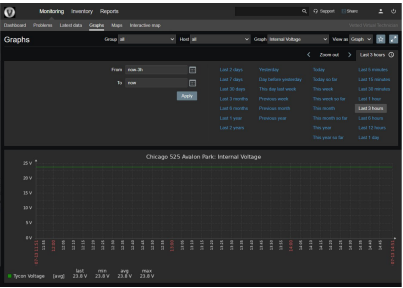
4 Select the data range you wish to report on:
Click one of the predefined time ranges (displayed in blue).
– OR –
Use the Calendar icon to the right of the From and To fields to manually select a time range.
5 Select the type of data you wish to report on from the Graph drop-down list.

See report descriptions below
6 Click Apply. The system generates your graph.
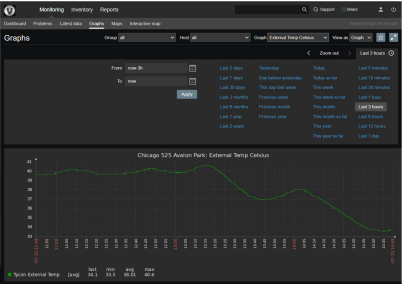
Figure 1: External Temperature Celsius Graph #
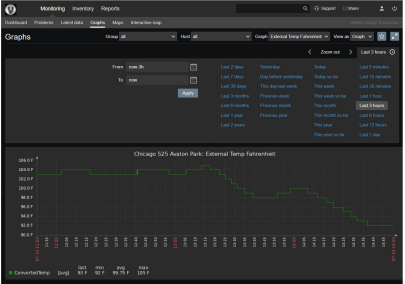
Figure 2: External Temperature Fahrenheit Graph #
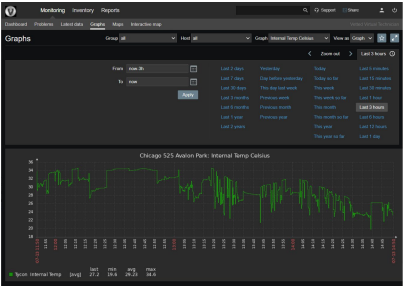
Figure 3: Internal Temperature Celsius Graph #