
OVERVIEW
Solar-powered systems are designed with a built-in level of battery autonomy, balancing cost, physical size, and operational runtime. Even with proper sizing, all systems have a finite reserve that will deplete during prolonged periods of insufficient sunlight.
There is a fundamental limitation: if there is no sun, there is no power. This is most acute during winter months, when shorter days and frequent cloud cover reduce solar availability.
This guide provides a standardized procedure for assessing system performance when solar production declines or the battery reports a low state of charge.
ASSESSMENT PROCEDURE
Step 1: Check Current Weather Conditions
Before performing technical diagnostics, verify site-level weather patterns.
- Use the following satellite visualization tool for real-time and historical imagery:
https://zoom.earth/maps/satellite/#view=27.9959,-83.283,7z
- Review the last 24 hours using the playback feature.
Significant cloud cover or overcast conditions typically correlate with reduced solar production
Step 2: Review Historical Cloud-Cover Data
Evaluate cloud conditions for the past several days to determine if weather patterns explain the reduced solar yield.
- Visit https://weatherspark.com/
- Enter the closest city or airport to the deployment site.
- Scroll to the Cloud Cover section.
- Examine the hourly cloud-cover chart.
- Heavy gray shading indicates limited solar availability.
- Extended gray periods directly correspond to low battery SoC or offline conditions
- Heavy gray shading indicates limited solar availability.
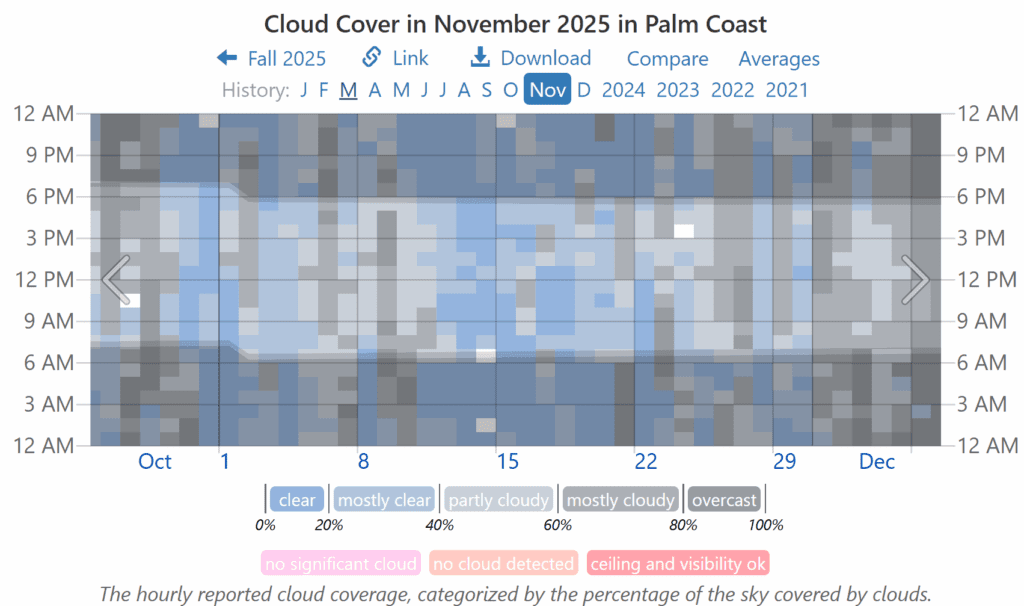
Note: Peak solar production generally occurs between 10:00 AM and 4:00 PM, with shorter windows during winter.
Step 3: Examine Solar Production via Victron VRM
Use VRM tools to compare forecasted solar irradiance against actual system performance.
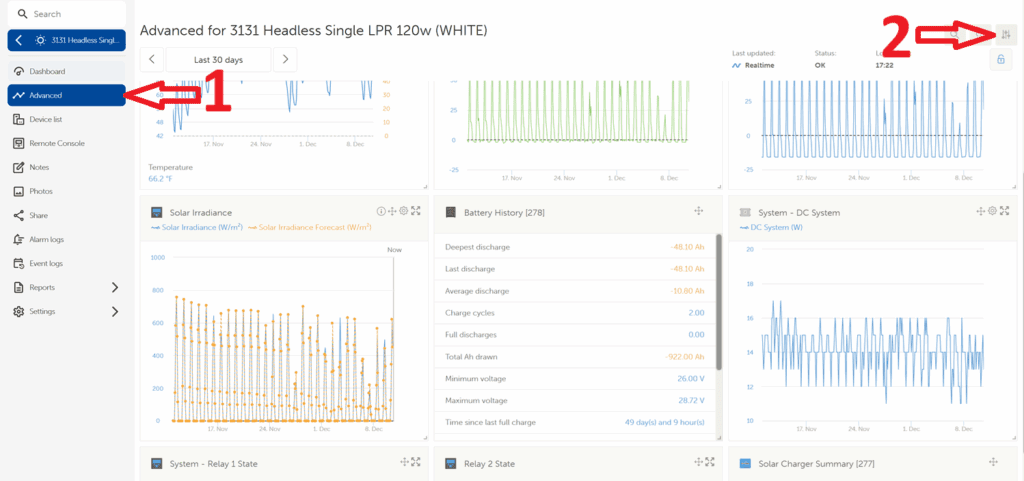
- Navigate to the site in Victron VRM.
- Open Advanced view.
- Enable the Solar Irradiance chart.
- This chart displays forecasted versus actual solar production.
- When actual production closely follows the forecast curve, the system is performing as expected.
- Significant deviations may indicate a hardware or system configuration issue.
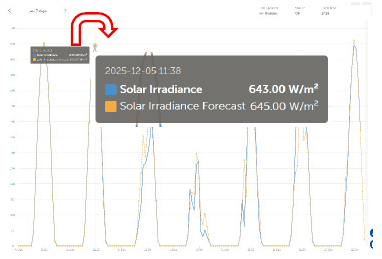
Note: This feature requires the site’s location to be properly set in VRM.
REFERENCE PROCEDURES
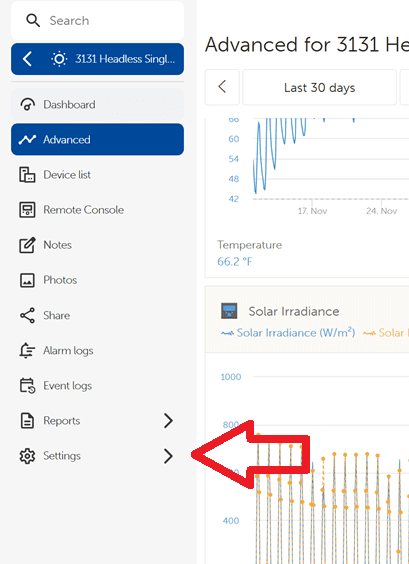
Reference 1: Enabling the Solar Irradiance Widget in VRM
- Open the site in VRM and Select Advanced view.
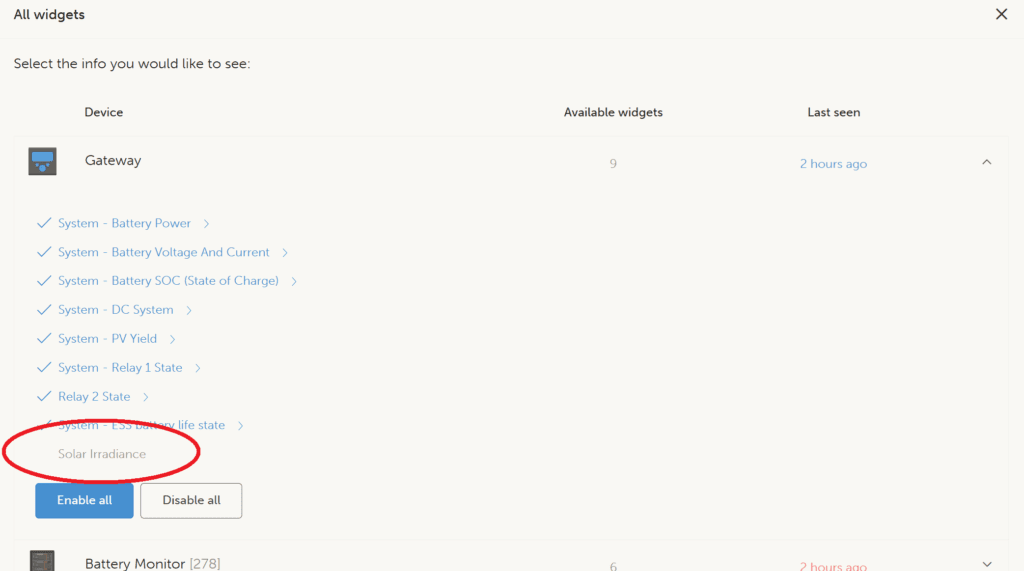
- Click the Filter button (top-right).
- Under Gateway, enable Solar Irradiance.
- Close the filter menu; the widget will now display.
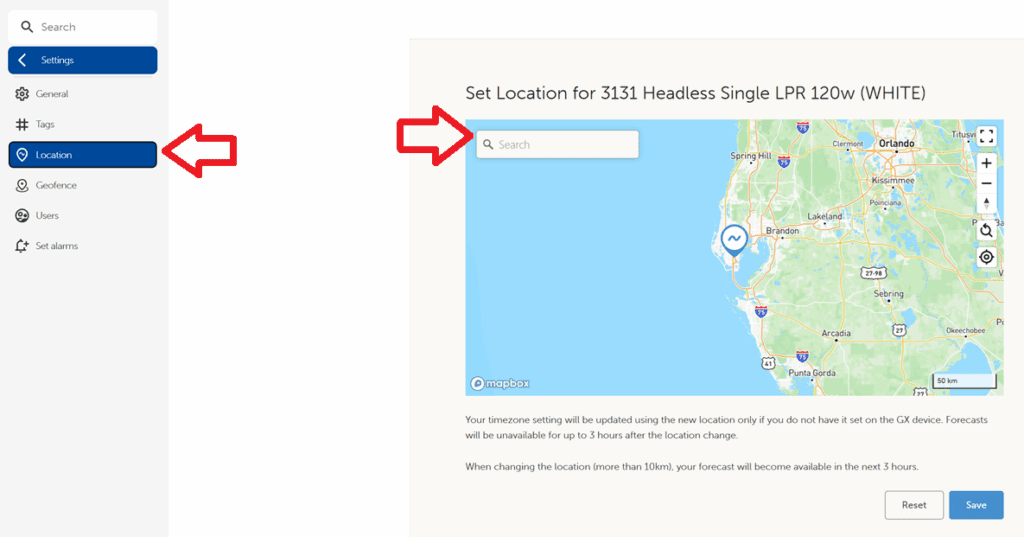
Reference 2: Setting the Site Location in VRM
- Navigate to the site in VRM.
- Select Settings.
- Click Location.
- Enter the correct site coordinates or address.
- Click Save.
Note: This process provides a preliminary assessment and should be completed before beginning deeper system diagnostics.